Die Werte, bevor der Fehler sichtbar wird
16 Kanäle, live per WLAN in der App
ProSense One fährt mit dem Bauteil durch die Lackierlinie und zeichnet Luftgeschwindigkeit, Feuchte und Temperatur Zone für Zone auf. Jeder Lauf liegt danach als ein Datensatz vor, mit allen Kanälen auf einer Zeitachse.
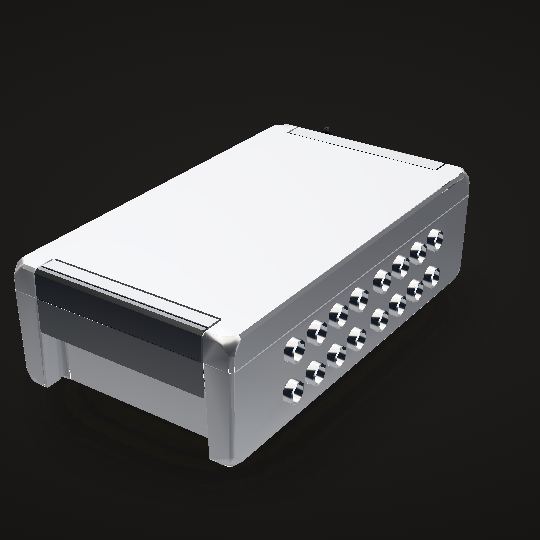
Ziehen zum Drehen
Was ProSense One kann
Die Linie läuft unter Soll.
Unter Soll heißt oft, Teile gehen in die Nacharbeit und die Linie verliert Ausbringung. Häufig liegt die Ursache in Werten, die selten am Bauteil selbst gemessen werden, etwa Feuchte, Temperatur und Luftströmung vor der Applikation. ProSense One fährt mit dem Bauteil durch die Linie und zeichnet sie Zone für Zone auf. Welche Größe an welcher Station zählt, legt die TPA fest.
Live-Daten per WLAN
Jeder Kanal wird während der Schicht per WLAN live übertragen. In der App laufen die Kurven mit, während der Koffer noch durch die Linie fährt.
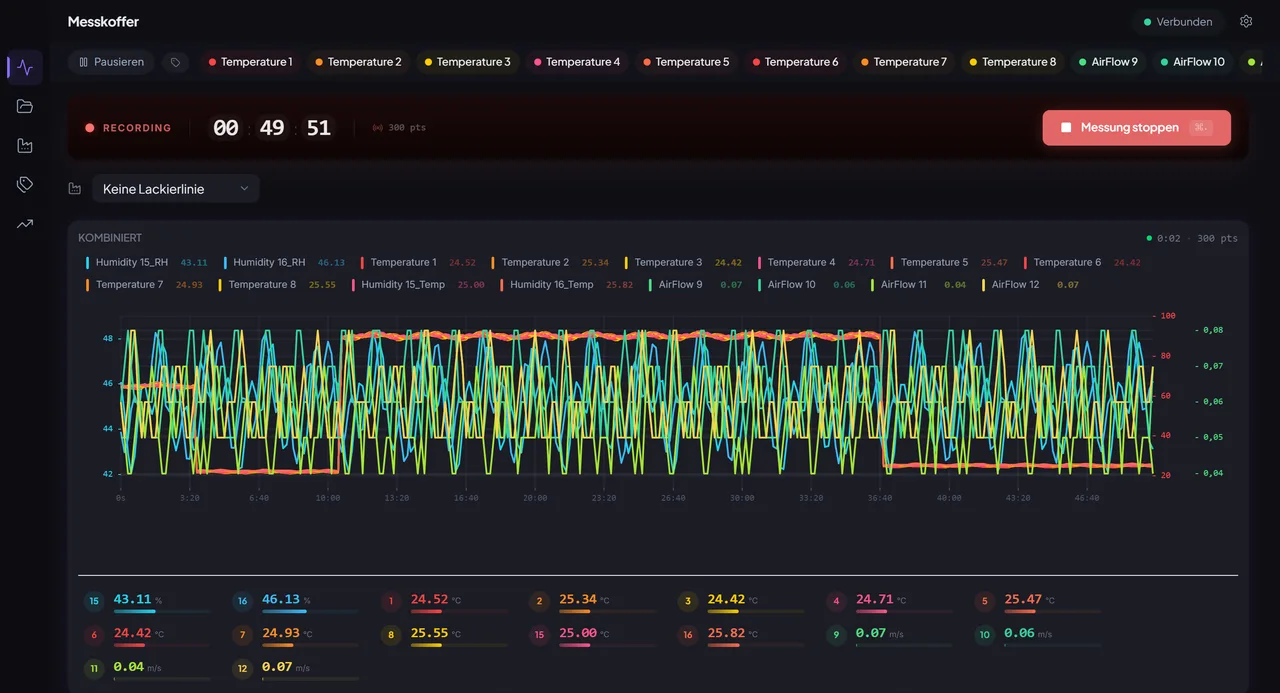
Live-Ansicht der App, Beispieldaten Partikelzähler
Misst mit, wie viele Partikel in der Kabinenluft stehen, dort wo Staub später als Einschluss im Lack auftaucht. In Entwicklung, die technischen Daten folgen, sobald sie bestätigt sind.
Luftgeschwindigkeit
Die Luftströmung Zone für Zone, 0–7 m/s, gemessen dort, wo das Bauteil gerade hängt.
Flüchtige organische Stoffe (VOC)
Die 8 digitalen Kanäle nehmen Luftgeschwindigkeit, Feuchte oder VOC auf.
Gehäuse IP67
Fährt ohne Sprühdruck durch die Waschzone und hält einen Temperaturschock von 100 → 16 °C aus.
LYO hilft beim Abstellen
Zeigt die Messung eine Abweichung, hilft LYO, die KI für die Fehlersuche, dem Bediener mit dem Erfahrungswissen von S4P, die Ursache abzustellen. Im Pilotbetrieb.
Mehr zu LYOMindestens 8 h Laufzeit
Li-Ion-Akku, werkzeuglos wechselbar.
Export
32 GB SD-Karte, CSV, WLAN + USB-C
ATEX und CE
Die Zertifizierung für ATEX Zone 2 ist in Vorbereitung, erteilt ist sie noch nicht. CE folgt mit der Serienlieferung.
TPA-Temperatur-Bauteil
Temperatur und Feuchte
8 Kanäle für Temperatur (Pt1000 Klasse A), die Feuchte über die digitalen Kanäle. Zusammen 16 Kanäle mit 1 Hz.

Im Koffer
Schale aus Gussaluminium, 299 × 173 mm, mit einem Scharnierprofil über die volle Kofferlänge und einem Verschluss, der sich von Hand ohne Werkzeug öffnen lässt. Die Deckeldichtung aus PU-Schaum (261 × 170 mm) hält den Innenraum dicht, Korpus und Deckel sind mit biolöslicher Mineralwolle isoliert, der Akku sitzt in einer eigenen gedruckten Thermohülle. Nach aussen führen 16 nummerierte ODU-Mini-Snap-Ports, Lichtleiter bringen die Status-LEDs durch die Dichtung, und die Dualband-WLAN-Antenne klappt flach an.
Baugruppen
Gehäuse, Dämmung, Sensoranschlüsse, Elektronik und Stromversorgung, jede Baugruppe mit ihrer Aufgabe.
Gehäuse
- Gehäusekörper
- Aluminium-Druckguss. Nimmt die Ofenhitze auf, damit die Elektronik es nicht muss.
- Deckel
- Öffnet am Scharnier zur Wartung. Trägt eine eigene Dämmschicht.
Dichtung
- Deckeldichtung
- PU-Schaum. Die Grenze zwischen Elektronik und Kabine.
Wärmedämmung
- Dämmung Korpus
- Biolösliche Mineralwolle. Der Grund, warum der Koffer den Trockner mit Elektronik übersteht.
- Dämmung Deckel
- Sitzt im Deckel und schließt die Dämmhülle nach oben.
Scharnier und Verschluss
- Lagerprofil
- Die Achse, um die der Deckel dreht, quer über die Schmalseite gegenüber dem Bedienfeld.
- Spannhebel
- Presst den Deckel auf die Dichtung. Von Hand zu öffnen, ohne Werkzeug.
Sensoranschlüsse
- ODU-Mini-Snap-Sensoranschluss
- Am Gehäuse nummeriert. Jeder nimmt einen Fühler für Temperatur, Feuchte oder Luftgeschwindigkeit auf.
Elektronik
- Interface-Platine
- Hier laufen alle Sensorkanäle auf.
- Funkmodul
- Trägt die WLAN-Verbindung, über die jeder Kanal während der Schicht live überträgt.
Stromversorgung
- Akku
- Li-Ion, wechselbar.
- Akkugehäuse
- Ein gedrucktes Gehäuse im Gehäuse. Der Akku bekommt seine eigene Dämmhülle.
Bedienfeld
- Log- und Stopp-Taster
- Lauf am Gehänge starten, am Gehänge beenden. Kein Laptop in der Kabine.
- Status-Lichtleiter
- Führen die Status-LEDs nach außen, ohne die Dichtung zu durchbrechen.
Antenne
- Antenne
- WLAN-Stab. Klappt flach, damit der Koffer unter der Fördertechnik durchgeht.
Technische Daten
| Datenübertragung | Live per WLAN | WLAN + USB-C |
|---|---|---|
| PartikelzählerIn Entwicklung | Daten folgen | |
| Luftgeschwindigkeit | 0–7 m/s | |
| Kanäle | 16, 1 Hz | 8 × Temperatur, 8 × digital |
| Gehäuse | IP67 | Waschzone ohne Sprühdruck |
| Temperaturschock | 100 → 16 °C | |
| KI für die FehlersucheIm Pilotbetrieb | LYO | |
| Akku | Li-Ion, mind. 8 h | werkzeuglos wechselbar |
| Speicher | 32 GB SD-Karte | CSV-Export |
| Abmessungen | unter 30 × 25 × 14 cm | höchstens 5 kg |
| Werkstoffe | silikon- und LABS-frei | |
| ATEX Zone 2In Vorbereitung | Zertifizierung | |
| CEAb Serienlieferung | Zertifizierung | |
| Temperatur | −50–260 °C | Pt1000 Klasse A |
| Feuchte | 0–100 % RH | ±2 % RH, Fühler bis 120 °C |
Alle Daten in einem Dokument
Messbereiche, Toleranzen, mechanische Daten, Schnittstellen und Konformität. Wir senden Ihnen das Datenblatt per E-Mail.
Die Messung zeigt die Abweichung. LYO hilft, sie abzustellen.
LYO ist die KI für die Fehlersuche in der Lackieranlage, entwickelt mit dem Erfahrungswissen von S4P. Im Pilotbetrieb, verfügbar für Pilotkunden.
LYO, die KI dazu